Our equity selection is a structured process and consists of several steps:
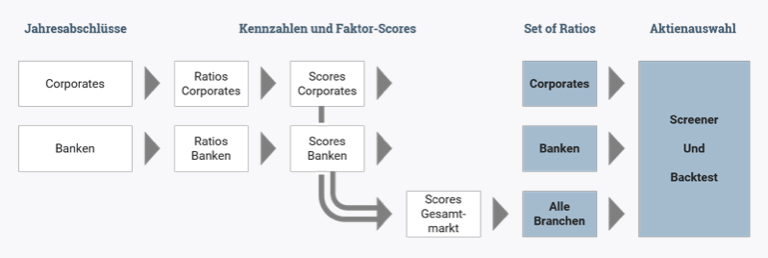
Some industries are subject to regulatory requirements that have an impact on company valuation and financial ratios. For example, banks must have a statutory minimum equity ratio. In addition, the peculiarities of the business model of credit institutions lead to significant differences in accounting and the key figures derived from them. A direct comparison with industrial companies, for example, would lead to a sector-related distortion of the results.
So that you don’t compare apples with oranges, our screener differentiates between key figures for banks, insurance companies and companies in other industries. In the first step of the equity selection, you therefore decide whether the screening should be carried out for financial stocks or non-financial stocks.
However, there is also the possibility to indirectly compare all equities with each other: All key figures of all stocks are divided into the five factors Value, Quality, Stability, Growth and Momentum and a separate score is calculated for each factor. These factor scores are indexed and in turn serve the relative comparability of all industries in the so-called “Screening Light”.
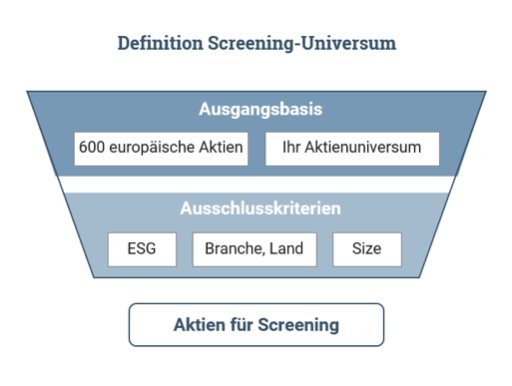
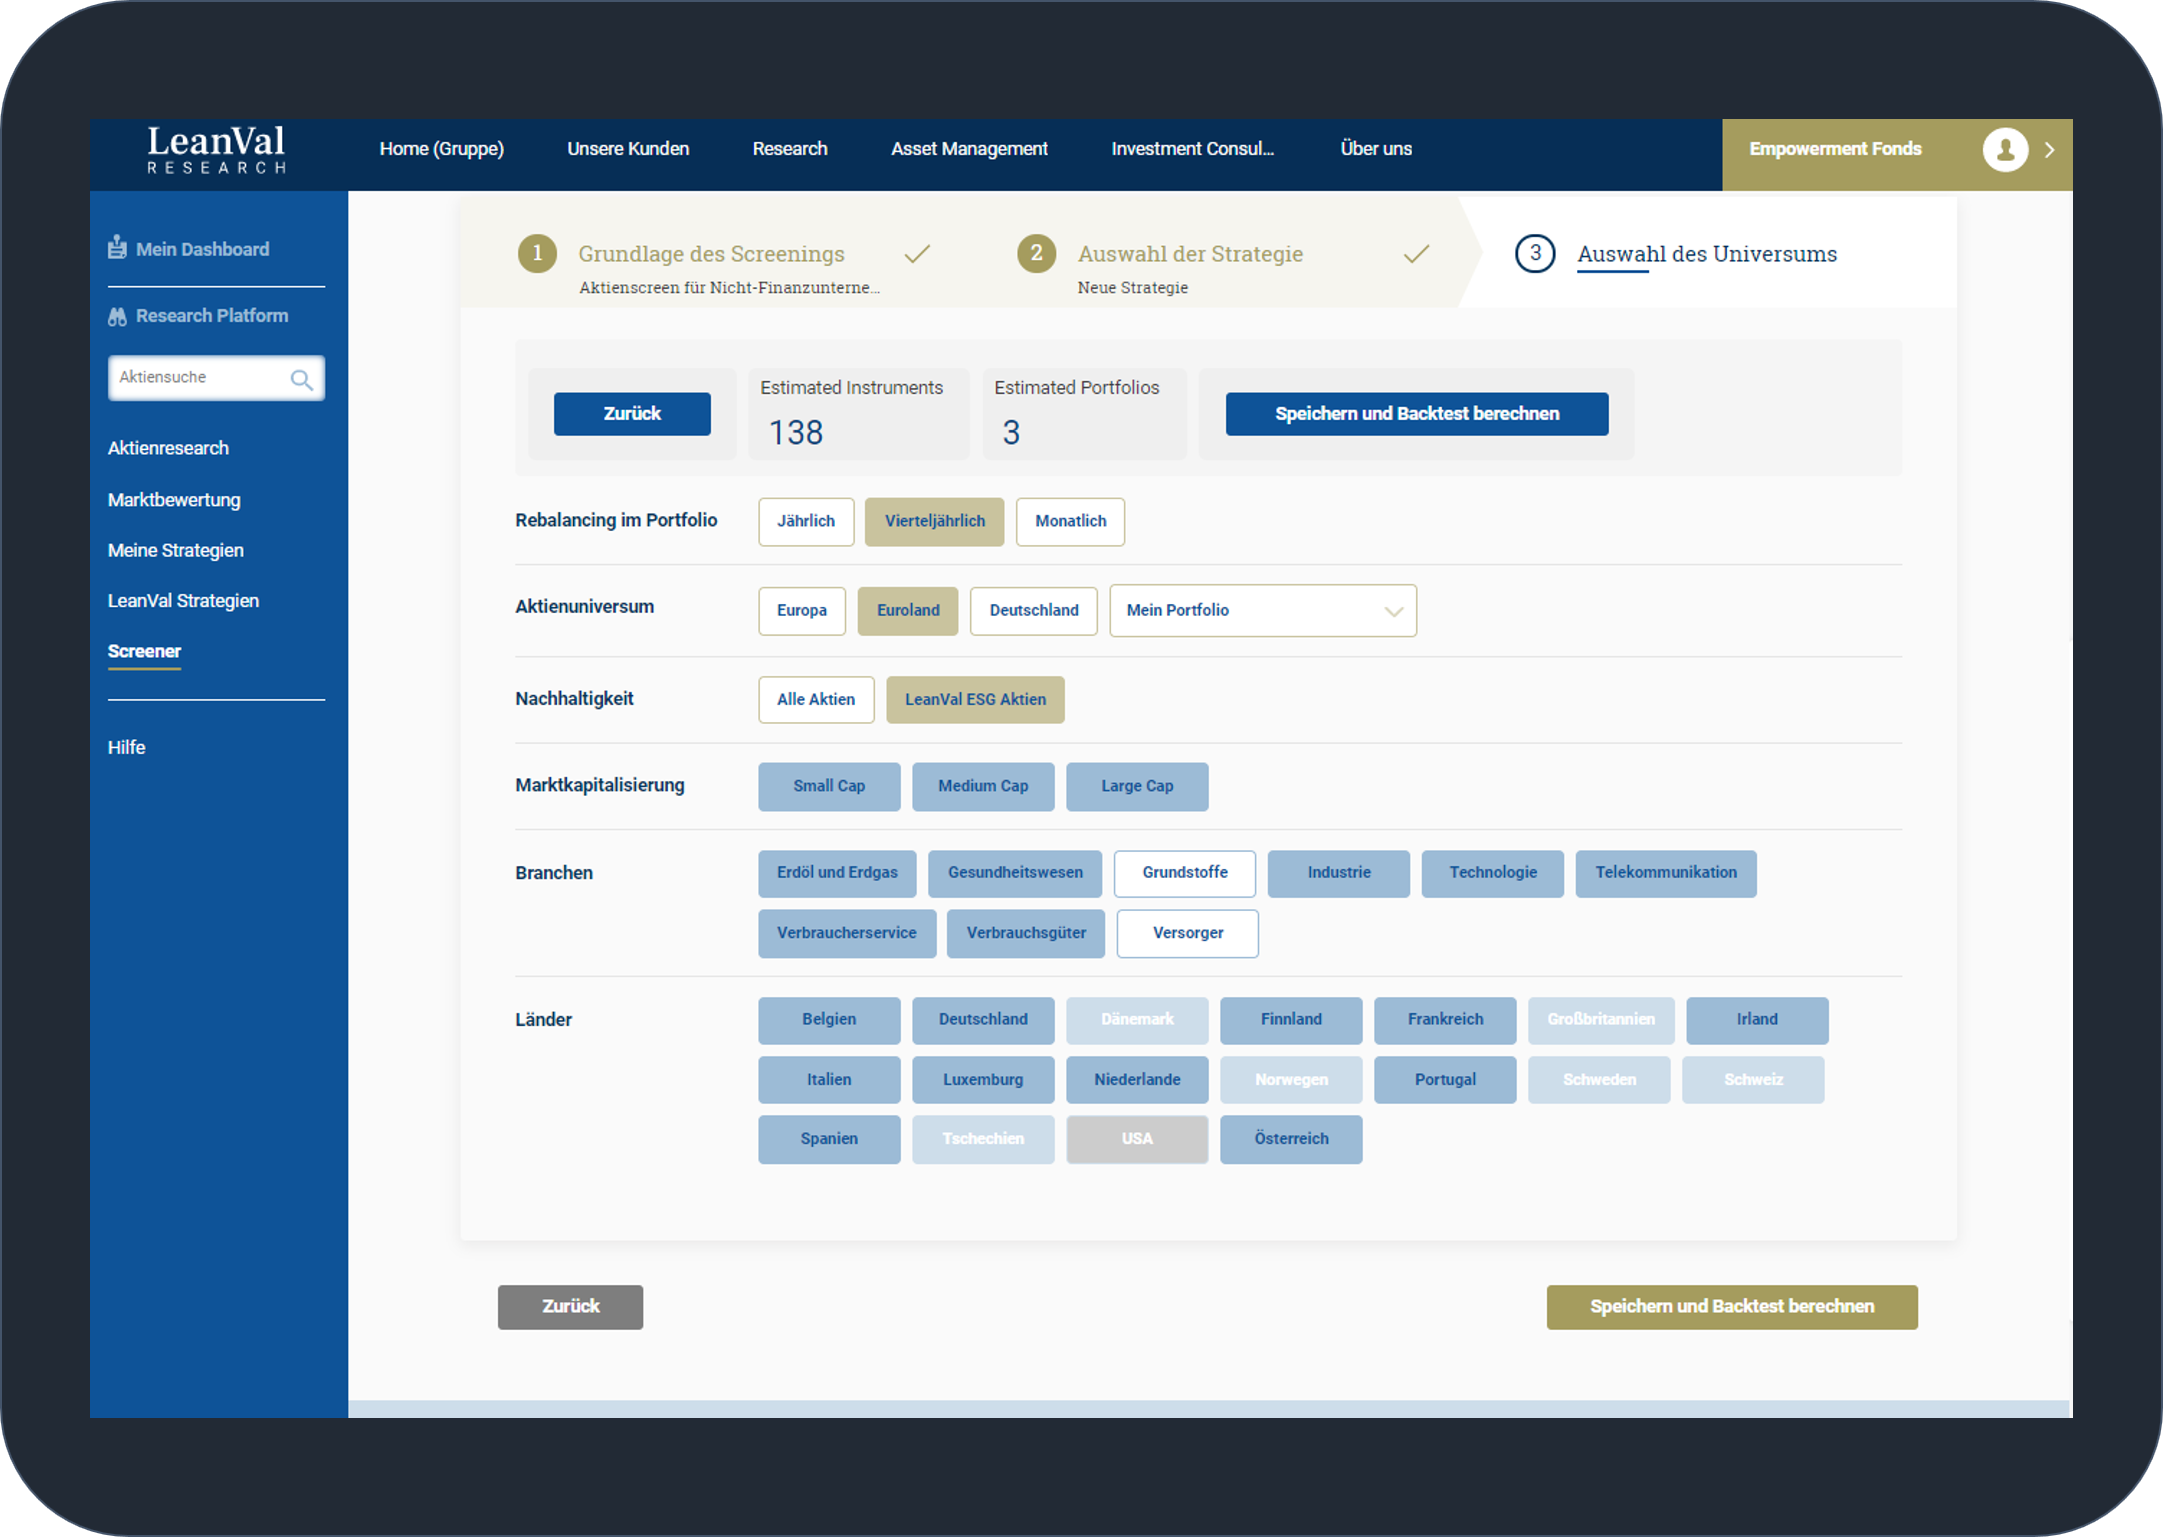
When selecting the universe, you have several setting options. You can determine which region is to be used as a basis: German stocks, stocks from the euro zone or stocks from all of Europe. This universe roughly corresponds to the 600 largest European companies. In addition, there are around 500 equities from the U.S. You also have the option of choosing one of your portfolios as the starting point for the screening. This is useful if you, as a bank or asset manager, have a defined list of stocks within which you are allowed to operate.
You can exclude certain industries or countries from the screening or narrow the universe according to market capitalization. Also in this step you select the frequency of the rebalancing. If you choose monthly rebalancing, the calculation of the back test takes about a minute. It’s much faster with annual rebalancing.
The number of equities available is always displayed at the top. In this example we have around 200 stocks available. Our application automatically calculates the number of portfolios into which the result will be divided. If there are more than 300 equities, the result is divided into ten portfolios and between 150 and 300 stocks in six portfolios. Three portfolios are formed from 150 equities.
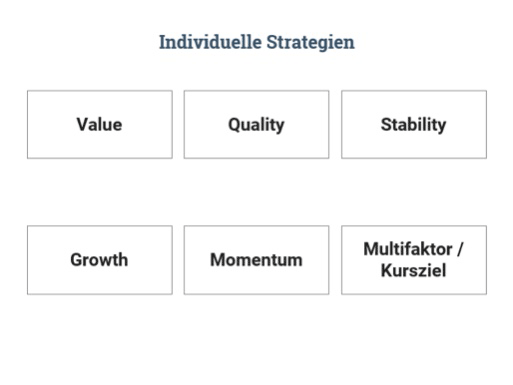
With an individual strategy, we enable you to select your personal strategy from several dozen key figures. All key figures are divided into the five factors. In the Multifactor section, you will find composite ratios, price targets, etc.
You can select several key figures within a factor. These key figures are weighted equally for this factor later in the calculation. If you select key figures from several factors, you can weight the factors differently. The sum of the factors must add up to 100 so that you can move on to the next step, selecting the universe. There is still the option to save the strategy.
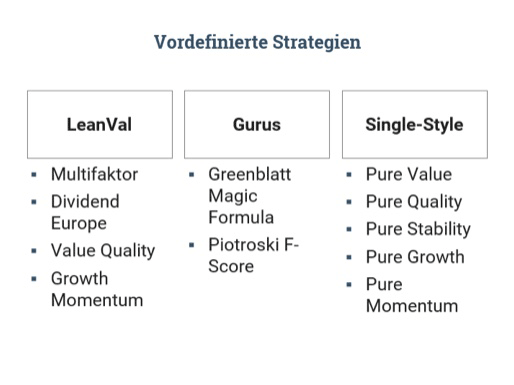
The preconfigured strategies are divided into LeanVal strategies, Guru strategies and single style strategies. The single style strategies reflect the five factors that they find throughout our application. With Value, for example, you can search for equities that have the highest value score.
The guru strategies are a little more interesting. Here, for example, we combine the five different factors into one strategy in the LeanVal total score, or we simulate strategies of well-known stock market gurus, such as the Greenblatt Magic Formula or the Piotroski F Score.
+49 69 949488 050
+49 69 949488 050