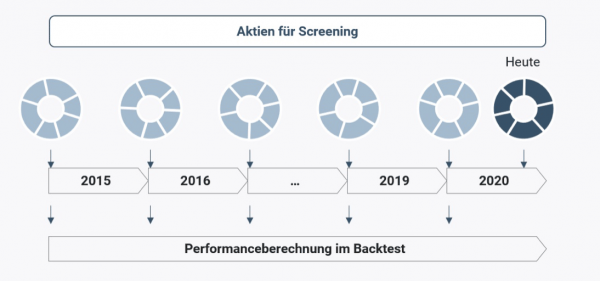
The backtest function is unique. The performance development of your individual strategy is calculated within a few seconds. This saves you tedious manual calculations that usually take several hours or days.
The backtest is calculated for the past 5 to 6 years. You can see the result on the one hand in the table and further down in the graphics performance development or development per year. The table shows the individual years or the average performance since the start of the test.
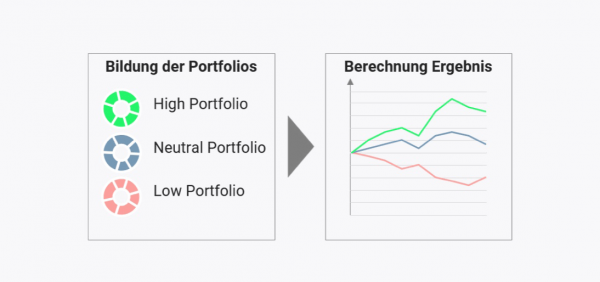
All equities contained in the starting universe were split into six portfolios. The portfolios with equities should have the highest potential according to the chosen strategy are combined to form the two “high” portfolios. The stocks that have the lowest potential according to the chosen strategy are broken down into the two “low” portfolios.

In the two graphics you can see the performance history since the start of the back test on the left for the portfolio groups and on the right for the individual portfolios. The performance development of the individual years is shown in the bar graphs.


+49 69 949488 050

+49 69 949488 050