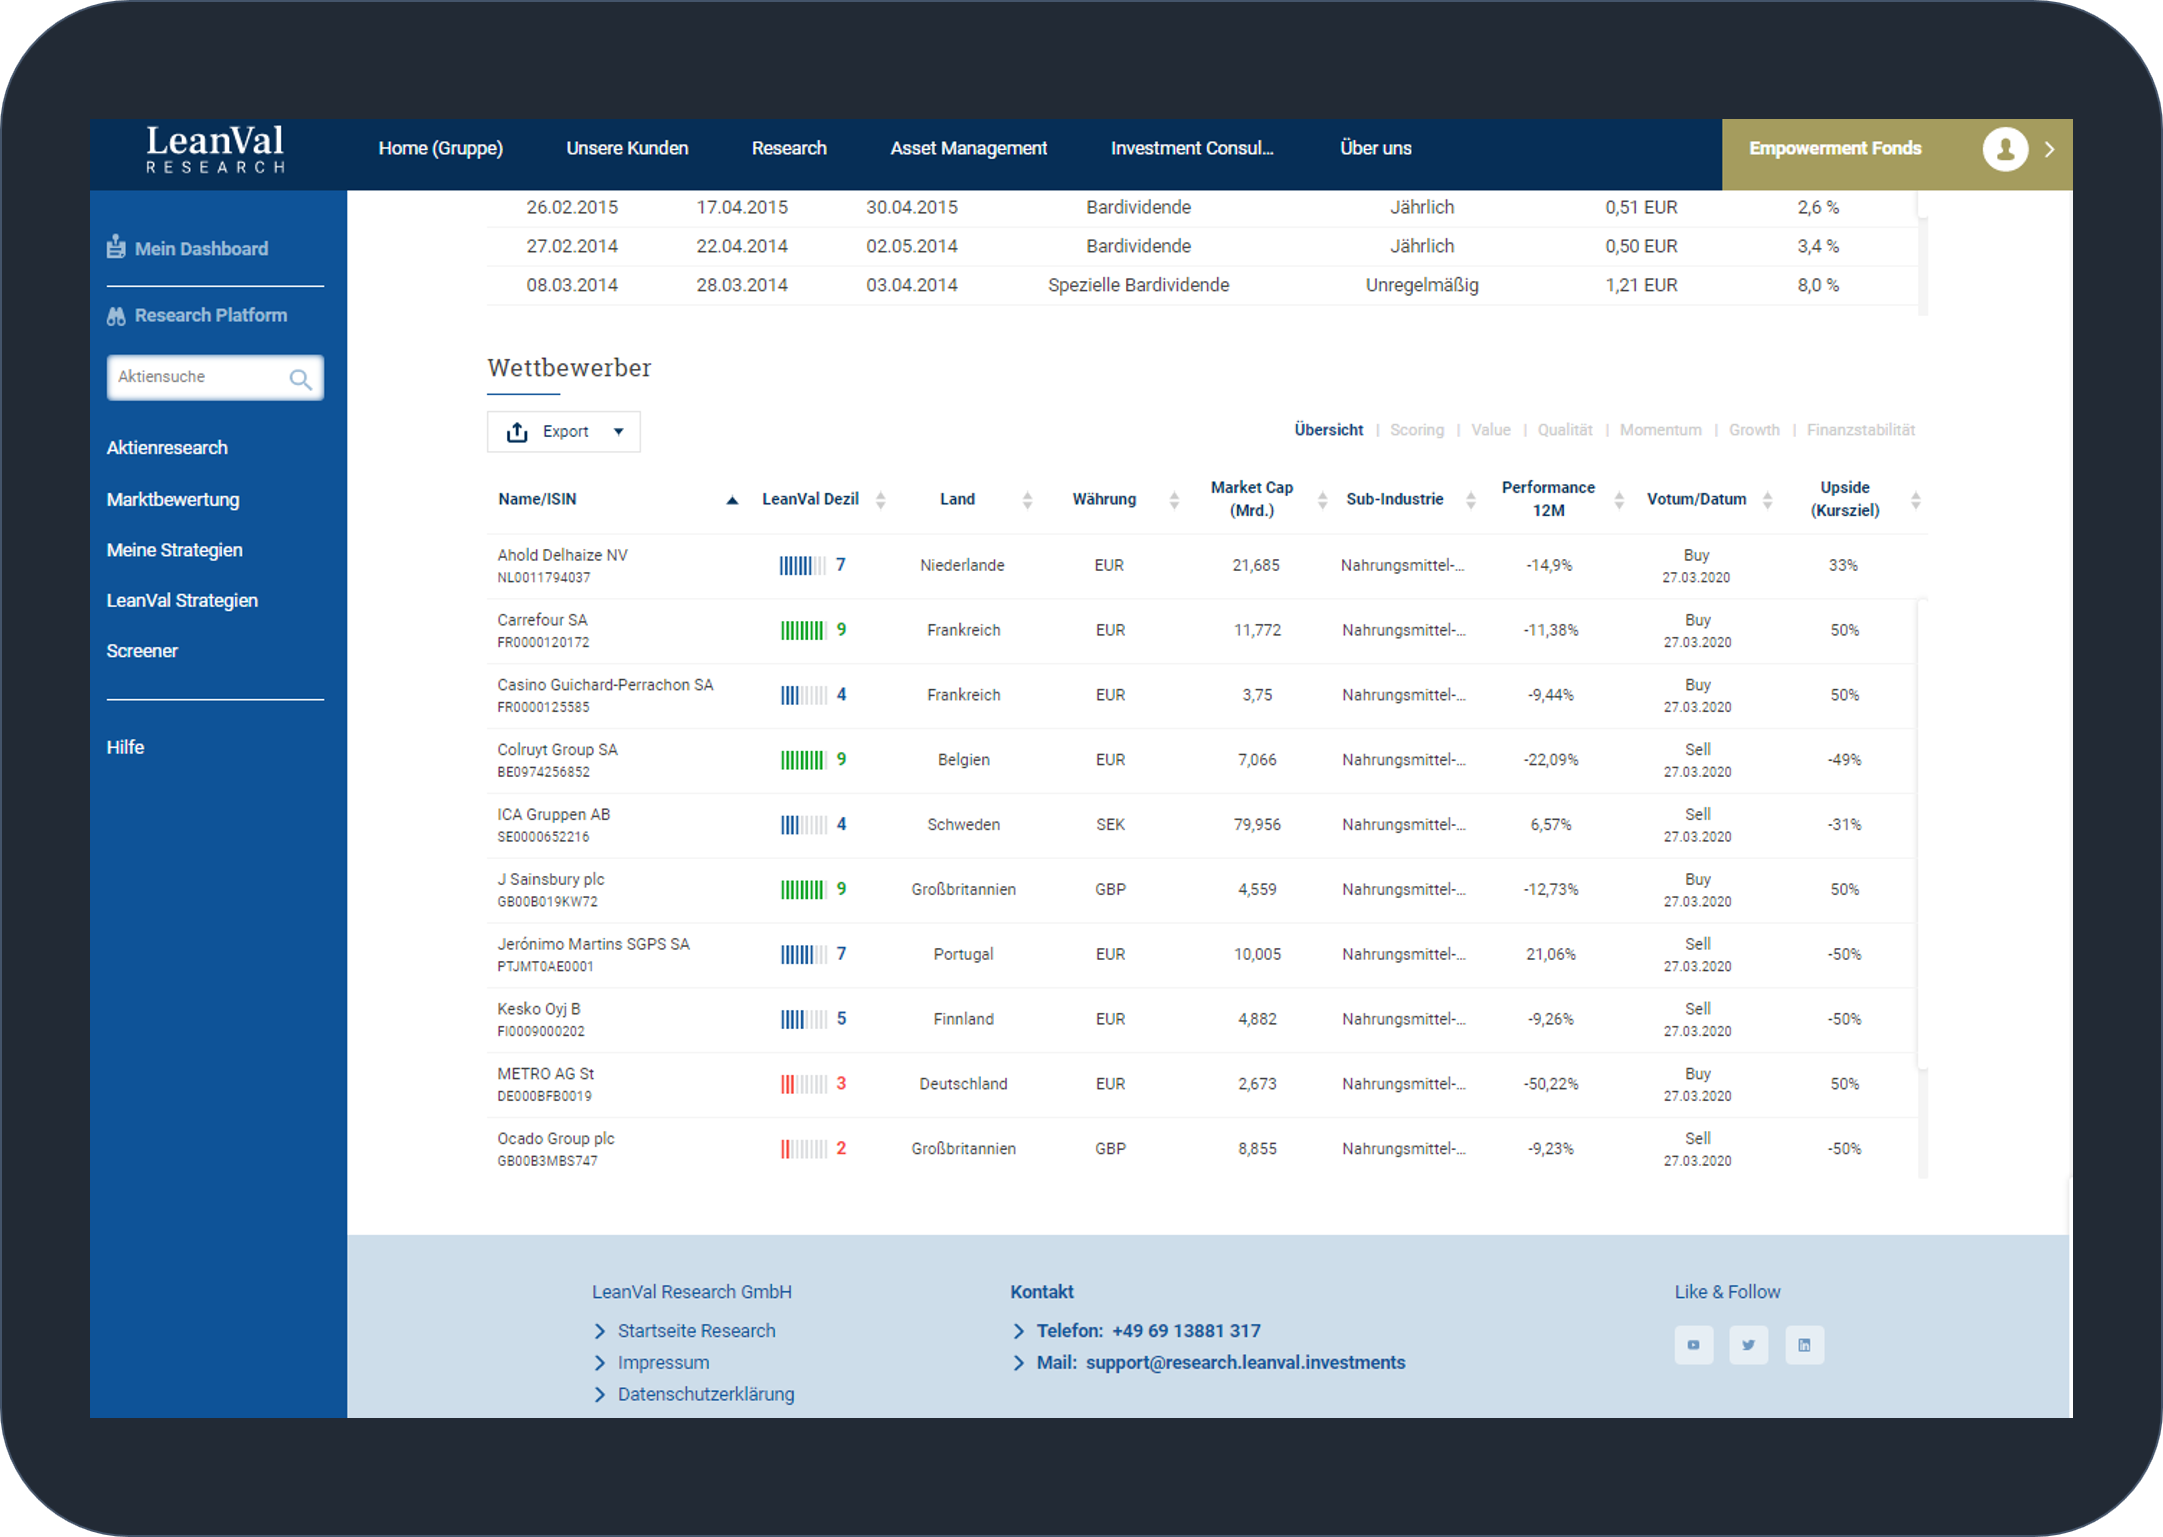
In the case of a relative assessment, a company is valued in relation to its competitors. This determines which stocks are most attractive within a sector or the market as a whole. LeanVal uses a self-designed and academically verified five-factor model for the assessment.
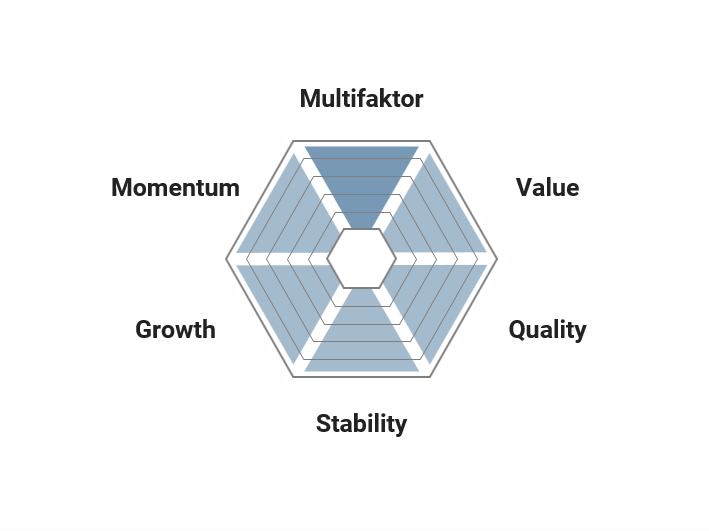
The LeanVal evaluation is based on the five factors Value, Quality, Stability, Growth and Momentum. These, in turn, are divided into a large number of meaningful key figures. A separate score is determined for each factor, which in turn can be compared with the median of the sector. LeanVal also calculates a total score that corresponds to the equally weighted average of the five factors.
A score is divided into ten deciles, which are based on the number of underlying values. If a share achieves a score of 10, it is, in relative terms, one of the most attractive 10% of the shares in the overall market. A share with a score of 1 therefore belongs to the 10% of the most unattractive companies on the market.
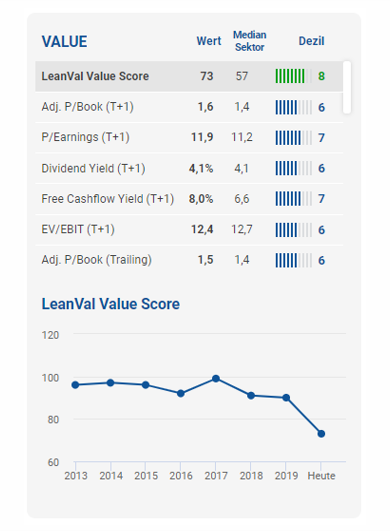
Value
Valuation ratios are used here, which compare the real economic value of a company with the current market value. Important key figures here include the price / book value ratio, the price / earnings ratio and the price / free cash flow ratio. Other key figures measure the ratio of enterprise value (market capitalization plus debt, minus total cash and cash equivalents) to EBIT, EBITDA or free cash flow. The key figures are adjusted by LeanVal in order to neutralize accounting policy measures and to make companies comparable.
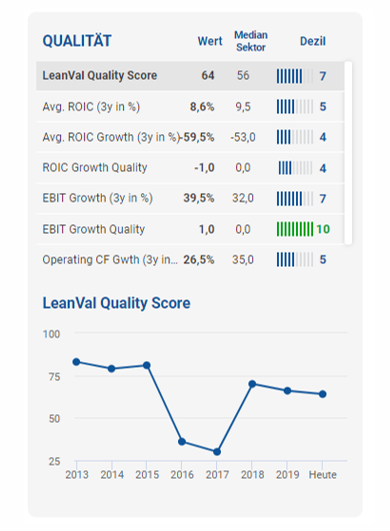
Quality
With this group of metrics, the focus is on the quality of operations. This is measured in particular with the key figures EBIT, operating cash flow and return on invested capital (ROIC). This not only takes into account whether a company can achieve growth with these key figures, but also with what continuity this growth is achieved. Particular attention is paid to the key figure ROIC (return on total capital). This has clear advantages over traditional profit numbers and is therefore better suited to show whether a company is successful. This is the case when the cost of capital can at least be covered and the company is adding value.
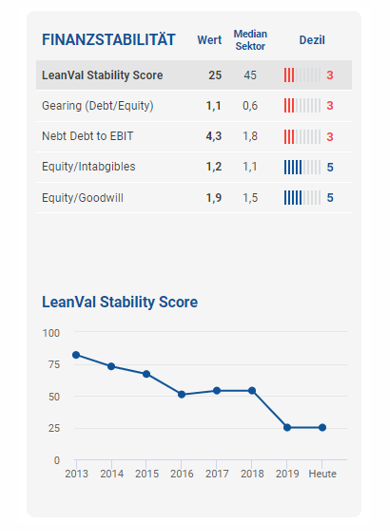
Stability
A company’s solvency and financing structure is an important factor in corporate development. A good substance enables a company to bridge phases of weakness, which has a significant effect on its stability. The key figures for the stability score include, among other things, the ratio of net financial debt to EBIT and the ratio of debt to equity (gearing). The intrinsic value of the assets on the balance sheet is measured by the ratio of equity to goodwill and equity to intangible assets.
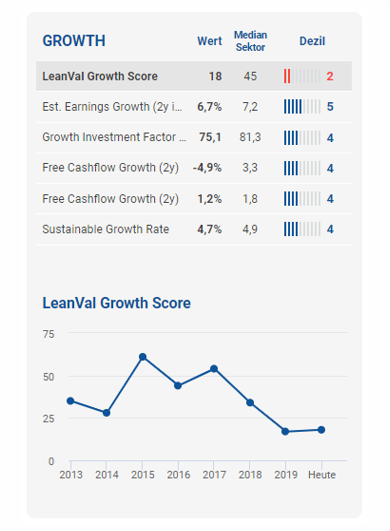
Growth
For many investors, the growth of a company is an important criterion when making an investment decision. But profits, cash flow and investments must be in balance. It is therefore advisable to use key figures that relate success to resource consumption. This also allows statements to be made about the structure or wear and tear of the existing substance. The LeanVal Growth Score therefore comprises the key figures expected profit growth and its sustainability, expected growth in free cash flow and the free cash flow margin as well as the ratio of investments to depreciation.
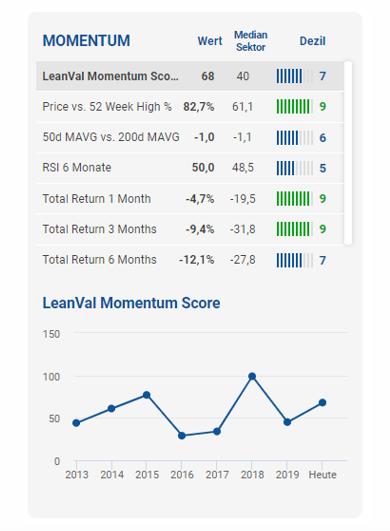
Momentum
Even cheap stocks can get cheaper. In order to avoid so-called value traps, it is important for LeanVal to include the current demand for individual companies in the overall assessment. Important key figures in the area of momentum are the price development in the recent past (1 month, 3 months, 6 months and 12 months) and the distance between the current price and the 52-week high. Further components of the score are the ratio of the share price on a 50-day average to the 200-day average (50d MAVG vs. 200d MAVG) and the relative strength index (6 months).
+49 69 949488 050
+49 69 949488 050