The data quality of LeanVal and the screener enable strategies of well-known stock market gurus to be replicated. The “classics” of stock picking include Joel Greenblatt’s strategy and Joseph Piotroski’s scoring model. In the future, we will model strategies for other stock market gurus. We are at your disposal for ideas and suggestions.
The “Magic Investing” formula is a quantitative investment approach that was developed and described by Joel Greenblatt (investor and lecturer) as early as 1980. The selection of equity investments is based on two factors. First, the companies are listed in ascending order according to the level of their return on capital employed (EBIT / total assets) and are given a value according to their rank. In a second step, the companies are listed in ascending order with regard to their valuation attractiveness (investment return = EBIT / Enterprise Value) and are in turn assigned a value according to their rank. The total factor results from the addition of the respective ranks, with a lower factor indicating a high level of attractiveness.
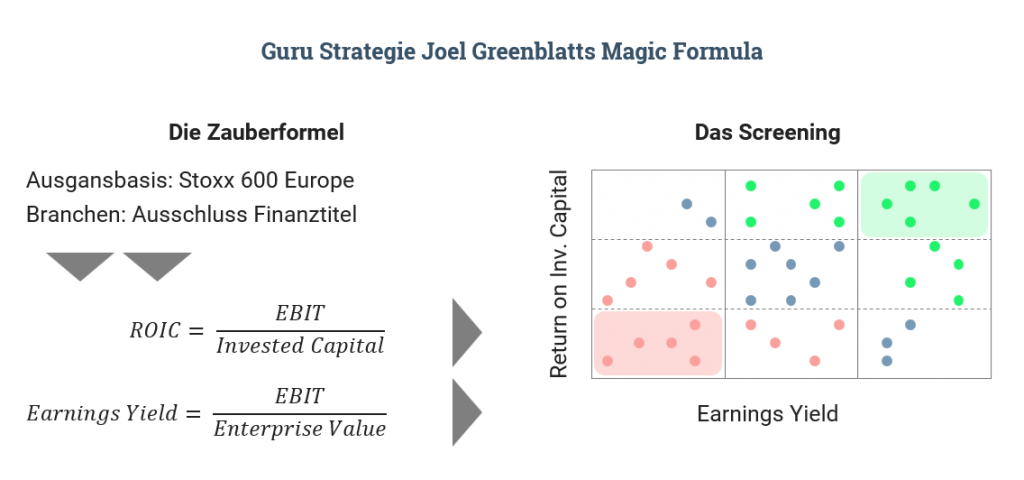
LeanVal considers the term “investment return” to be more advantageous than the term “profit return”, which is also commonly used in the literature. Since a profit figure (EBIT = earnings before interest and taxes) is set in relation to the enterprise value (equity + net debt), i.e. to the current total company value, this results in a return on the potential total investment.
Greenblatt ignored financial and utility values in its original approach. In this screen, the return on investment is based on estimates for the next two years.
Stanford professor Joseph Piotroski published numerous publications on value investing strategies. The so-called “F-Score” became particularly well known. With the help of the score, the level or the change in nine different key figures is examined, whereby the last two financial years are compared with each other. If the value is positive or if the key figure has improved in relation to the previous financial year, it is rated 1 (positive), otherwise it is rated zero. This procedure is carried out with all nine key figures so that the Piotroski F-Score can assume a value between 0 and 9. The higher the value achieved, the more positive a share appears. The nine key figures are in turn assigned to the three categories of profitability, financial quality and operational quality (efficiency).
In the area of profitability, it is determined whether there is a positive annual profit as well as a positive operating cash flow. The operating cash flow should also be greater than the annual surplus. It is also rated positively if the return on assets (return on total capital employed) is higher in the current financial year than in the previous year.
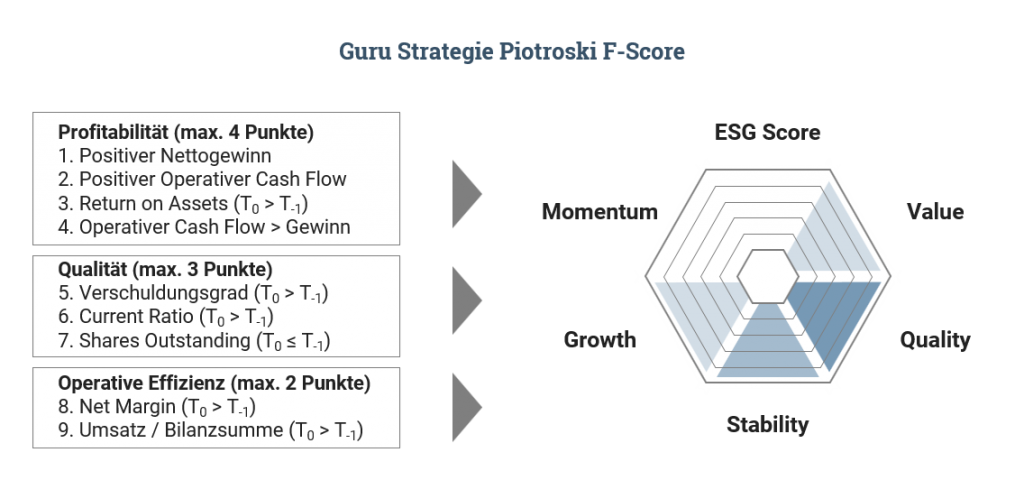
The financial quality measures the changes in the long-term debt level, the change in the current ratio (3rd degree liquidity) and the increase in the number of shares outstanding. A change is rated with 0 because in this case the company has financed itself through a capital increase. The other two factors also rate the improvement in debt and liquidity positively.
In terms of operational quality, both an improvement in the gross margin and in the capital turnover are rated positively. It should be noted here that the capital turnover is calculated as sales divided by the balance sheet total. In the broadest sense, it is about improving overall profitability.
+49 69 949488 050
+49 69 949488 050